SnackMap is a GIS-based tool designed to visualize food environments by mapping the balance of healthier and less healthy food options within a community.
Explore SnackMapFood access is often discussed primarily in terms of distance to grocery stores. However, the balance of food options within a neighborhood can shape everyday choices even when food is technically accessible.
Areas oversaturated with unhealthy options can make healthy decisions harder, particularly for students and families navigating daily routines.
I designed SnackMap to help make these patterns visible locally and support more informed conversations about food environments.
Locations of food outlets within a defined county or area.
Visualize the different types of options available, drawing out the balance of options in the community.
Overlays, such as Title I schools, to zoom in to youth food environments.
We've used SnackMap to support advocacy and plan service events. One example is Hope Against Hunger, a student-led ACE initiative at Castilleja School. We partner with Second Harvest of Silicon Valley.
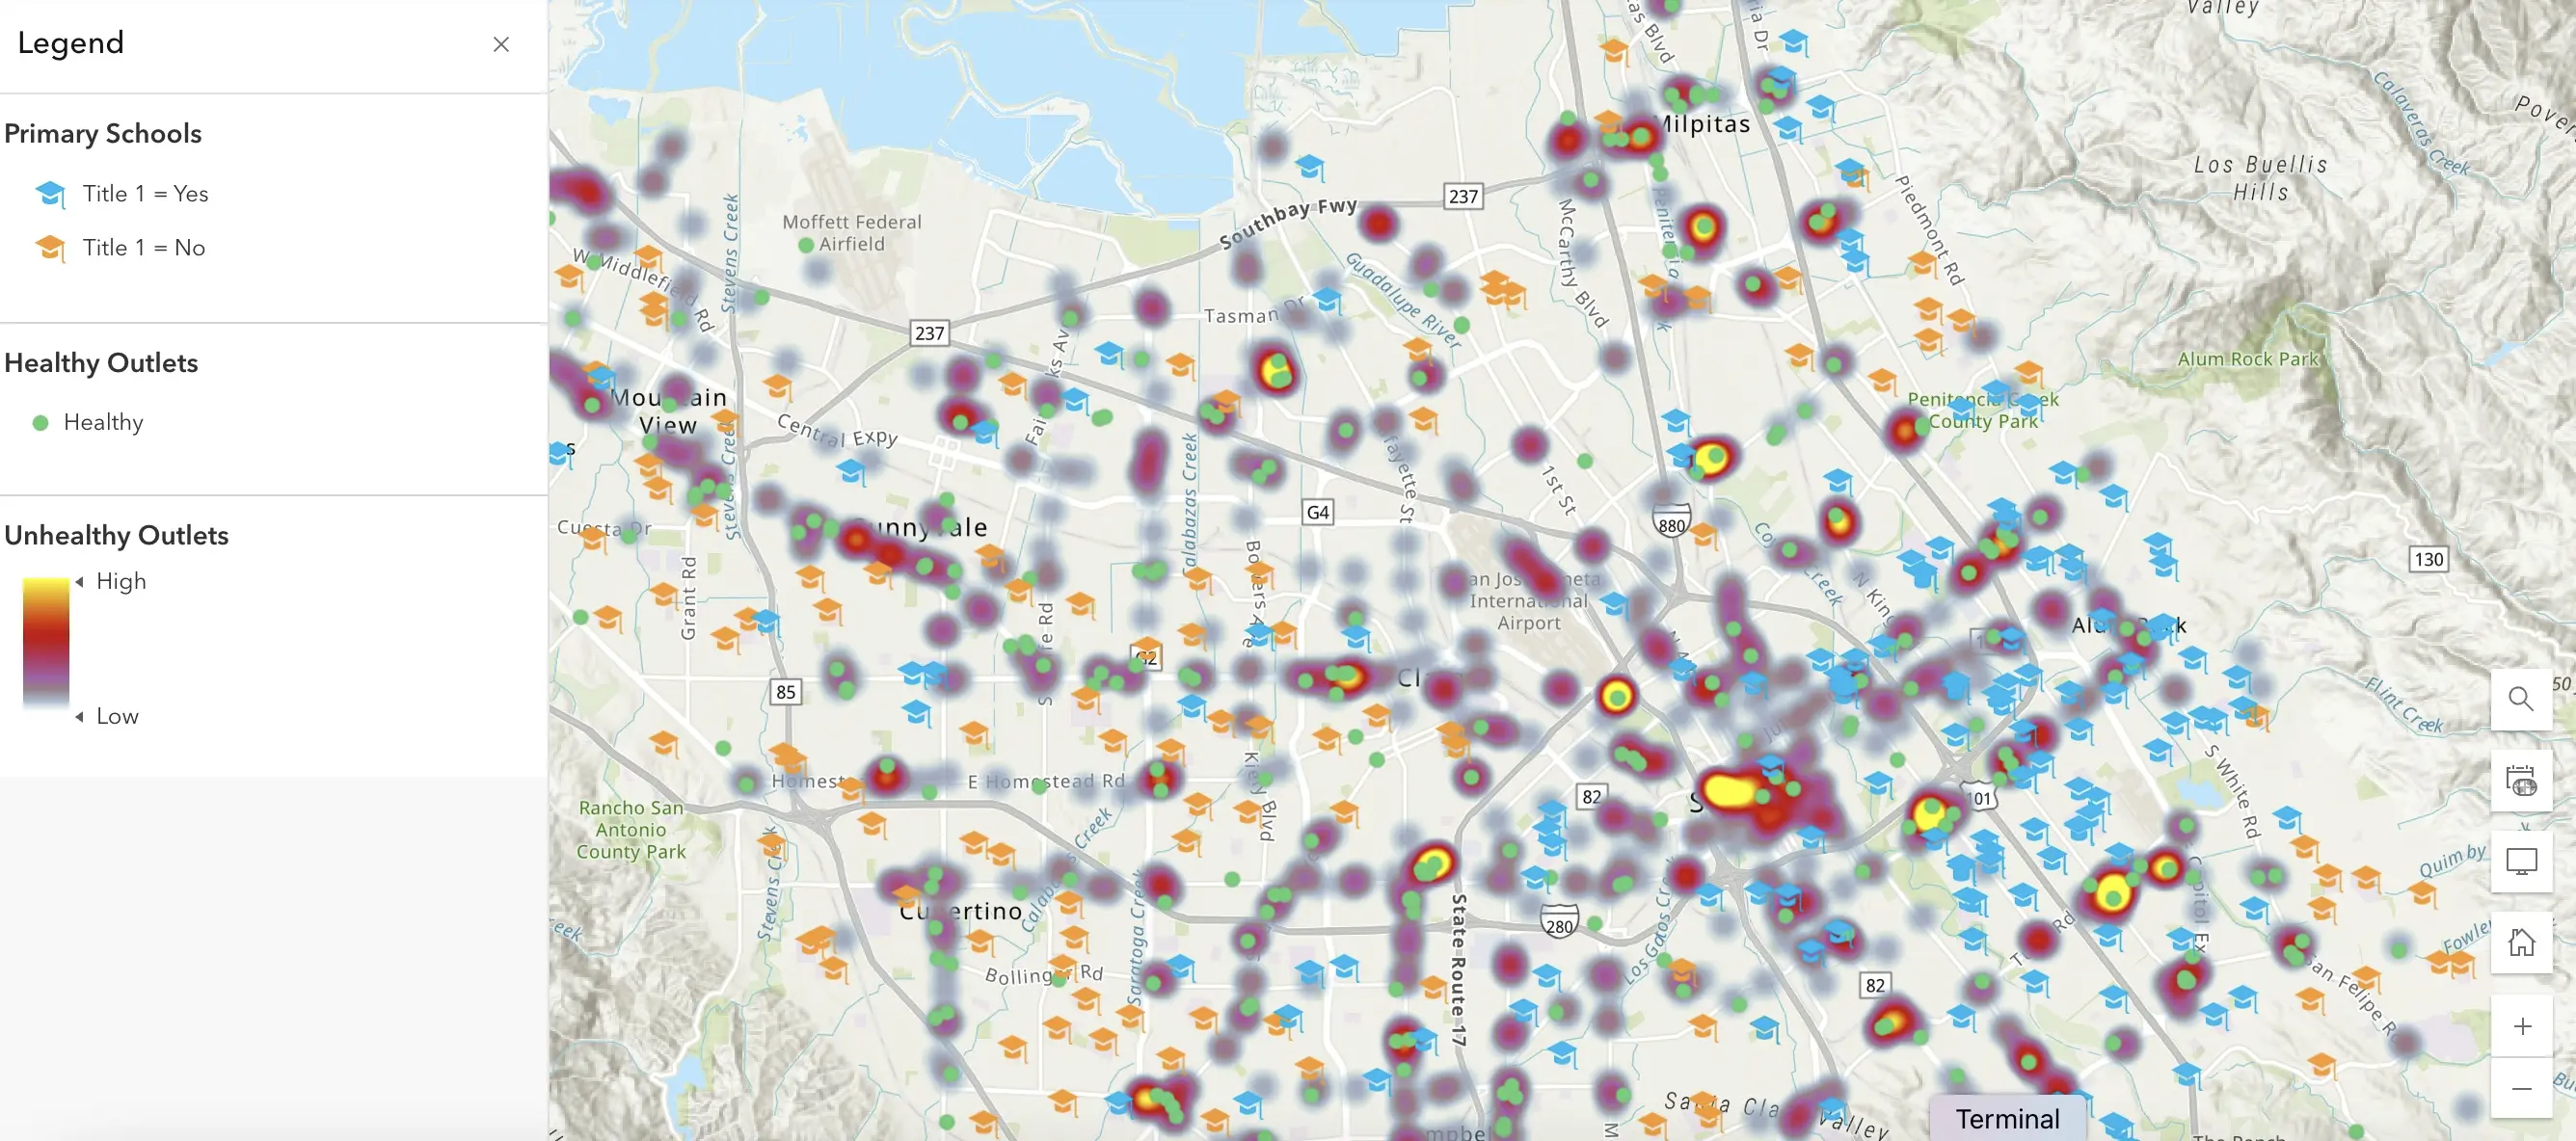
SnackMap aims to help students connect local food environment patterns to discussions, events, and service activities, and informed the choice of locations of food drives.
Healthier Ground documents this work as one example of how data tools can support thoughtful, locally grounded action.
SnackMap uses publicly available data, including:
SnackMap does not label neighborhoods or prescribe solutions. It is designed to support learning and local decision-making by making conditions easier to see and discuss.